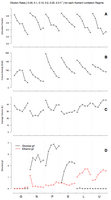
Measured characteristics of cultures at steady-state. Limiting nutrients at bottom of figure: glucose (G), ammonium (N), phosphate (P), sulfate (S), leucine (L), uracil (U). Within each limitation, dilution rates are ordered from 0.05hr-1 to 0.3hr-1 in 0.05hr-1 increments. (A) Fraction of unbudded cells. (B) Steady-state culture density in Klett units. (C) Average cell volume. (D) Residual glucose and ethanol levels.
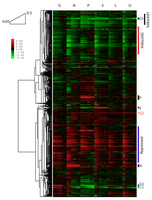
Hierarchical clustering of expression values across dilution rates and limiting nutrients. Clustering by Pearson correlation reveals many up- and down-regulated clusters spanning all nutrient limitations (e.g. Induced1, Induced2, Repressed) and few smaller gene groups regulated in a nutrient-specific manner (e.g. G1-G4, P, S, N). Reference for all samples is from a glucose-limited chemostat at 0.25hr-1. Conditions are as in Figure 1.
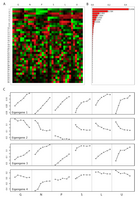
SVD decomposition of expression data. Singular value decomposition of the growth rate/nutrient limitation microarray data shows that a large portion of the variation in gene expression (>70%) is related to changes in growth rate. Secondary eigengenes also capture nutrient-specific responses (e.g. phosphate and sulfate). (A) 36 eigengenes. (B) Eigengene weights (eigenvalues). (C) Expression levels of the four most significant eigengenes.
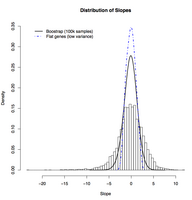
Distribution of experimental growth rate responses versus bootstrapped background distribution. A histogram of the estimated regression slopes for 5537 genes is compared to a 100,000-point bootstrapped null distribution of slopes (density estimate; black, solid line) and to the distribution of slops corresponding to genes that do not respond to growth rate (density estimate; dash-dotted, blue line). The expression responses of genes in our microarray data are significantly broader than expected by chance, while genes we determine to be largely unresponsive to changes in growth rate have slopes near zero.
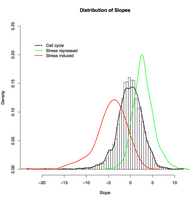
Transcriptional response of stress-related and cell-cycle-related genes to changes in growth rate. Genes expressed periodically during the cell cycle (black line, Spellman et al. 1998) are distributed essentially as background, while genes induced (red line) or repressed (green line) by stress (Gasch et al. 2000) tend to be conversely repressed or induced as growth rate increases.
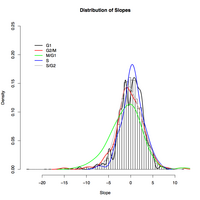
Distribution of growth rate response slopes for genes specific to individual cell cycle phases. A breakdown of cell cycle specific gene response to growth rate by phase shows little variation from background. The 89 genes expressed in the M-G1 phase have a slight tendency to be downregulated as growth rate increases.
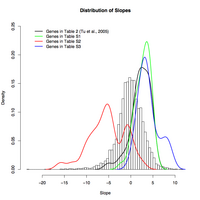
Distribution of regression slopes for metabolic cycling conditions of Tu et al. 2005. In our expression data, Tu et al.'s "most periodic" genes during metabolic cycling (their Table 2, black line) are induced as growth rate increases, as are their mitochondrial and cytoplasmic ribosomal clusters (their Supplemental Tables S1 and S3, green and blue lines). Peroxisomal genes (their Supplemental Table S2, red line) respond bimodally to growth rate, with the majority showing negative correlation and the minority not responding substantially to growth rate (including several stress response genes).
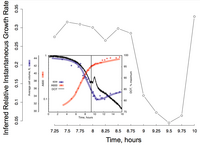
Inferred instantaneous growth rates in batch culture undergoing the diauxic shift. The main figure shows the relative growth rates inferred by our linear model from microarray data in Brauer et al. 2005. The inset, from Brauer et al., demonstrates that their observed variations in cell volume and dissolved oxygen exactly match our predicted cessation of growth as the diauxic shift occurs (ca. 9.25-9.75hr).