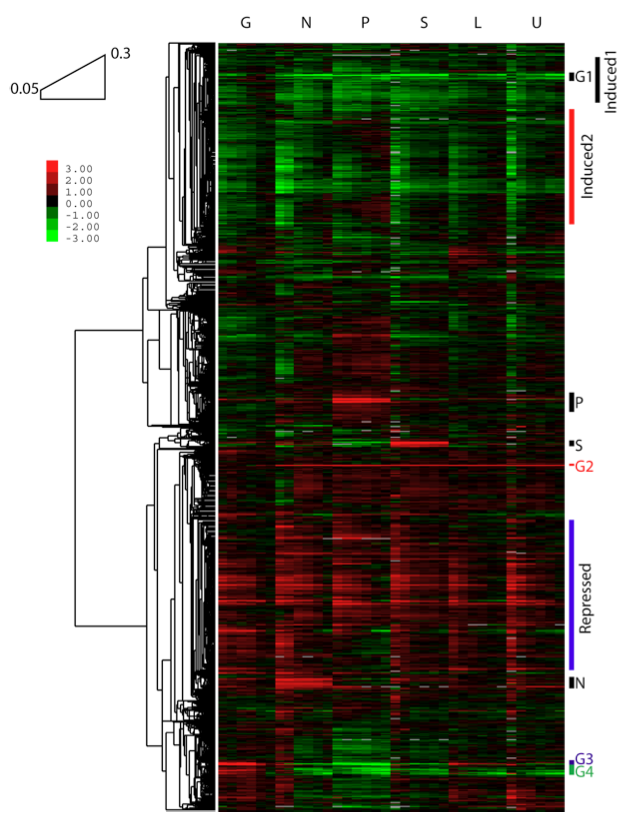
Hierarchical clustering of expression values across dilution rates and limiting nutrients. Clustering by Pearson correlation reveals many up- and down-regulated clusters spanning all nutrient limitations (e.g. Induced1, Induced2, Repressed) and few smaller gene groups regulated in a nutrient-specific manner (e.g. G1-G4, P, S, N). Reference for all samples is from a glucose-limited chemostat at 0.25hr-1. Conditions are as in Figure 1.
Figure as PDF