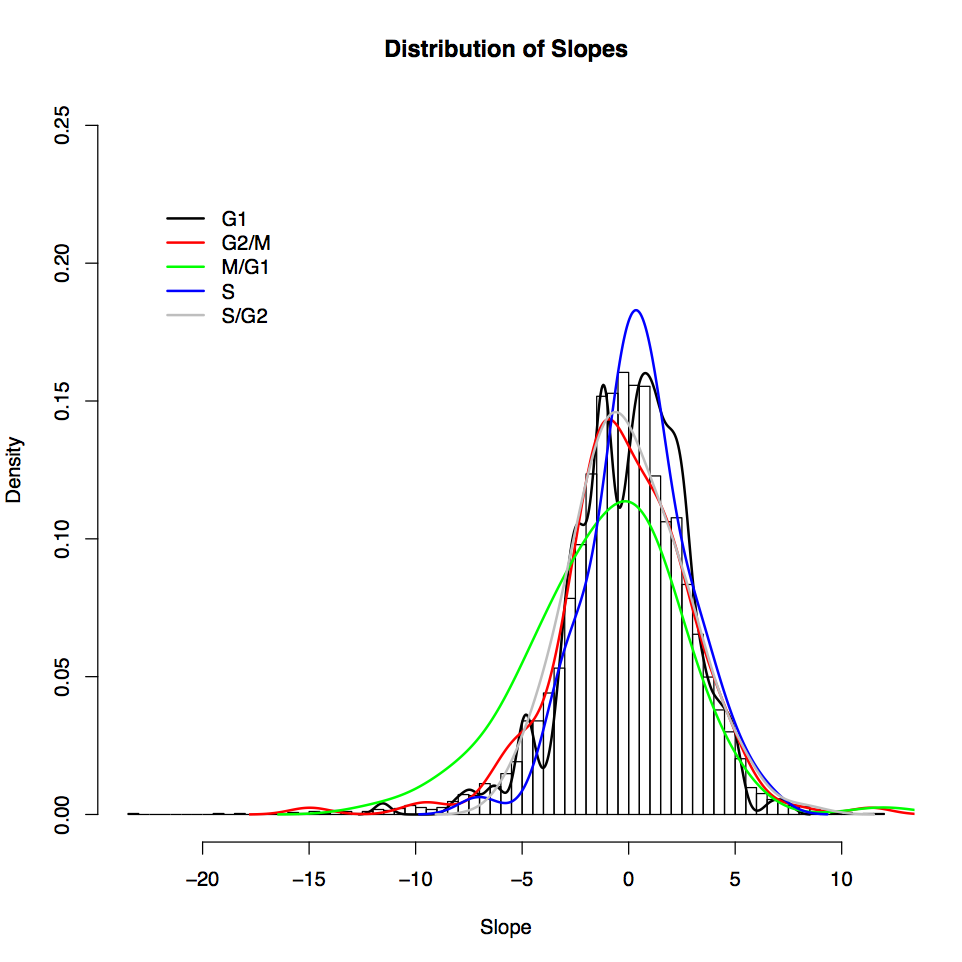
Distribution of growth rate response slopes for genes specific to individual cell cycle phases. A breakdown of cell cycle specific gene response to growth rate by phase shows little variation from background. The 89 genes expressed in the M-G1 phase have a slight tendency to be downregulated as growth rate increases.
Figure as PDF