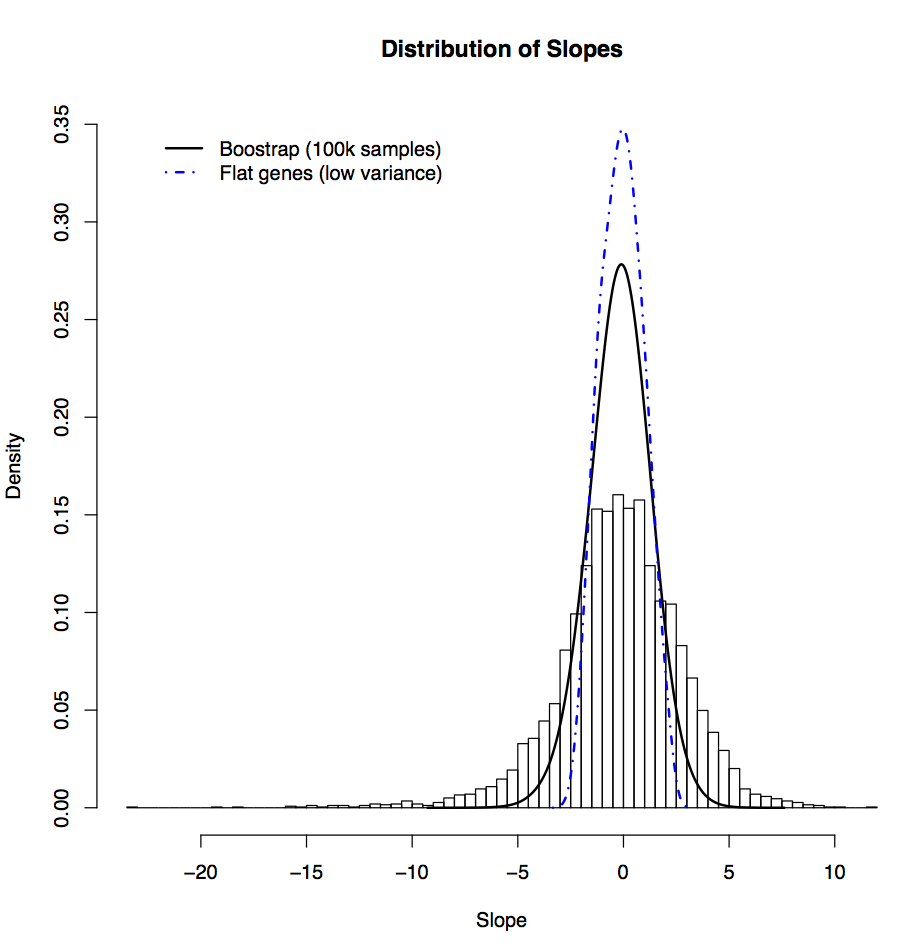
Distribution of experimental growth rate responses versus bootstrapped background distribution. A histogram of the estimated regression slopes for 5537 genes is compared to a 100,000-point bootstrapped null distribution of slopes (density estimate; black, solid line) and to the distribution of slops corresponding to genes that do not respond to growth rate (density estimate; dash-dotted, blue line). The expression responses of genes in our microarray data are significantly broader than expected by chance, while genes we determine to be largely unresponsive to changes in growth rate have slopes near zero.
Figure as PDF