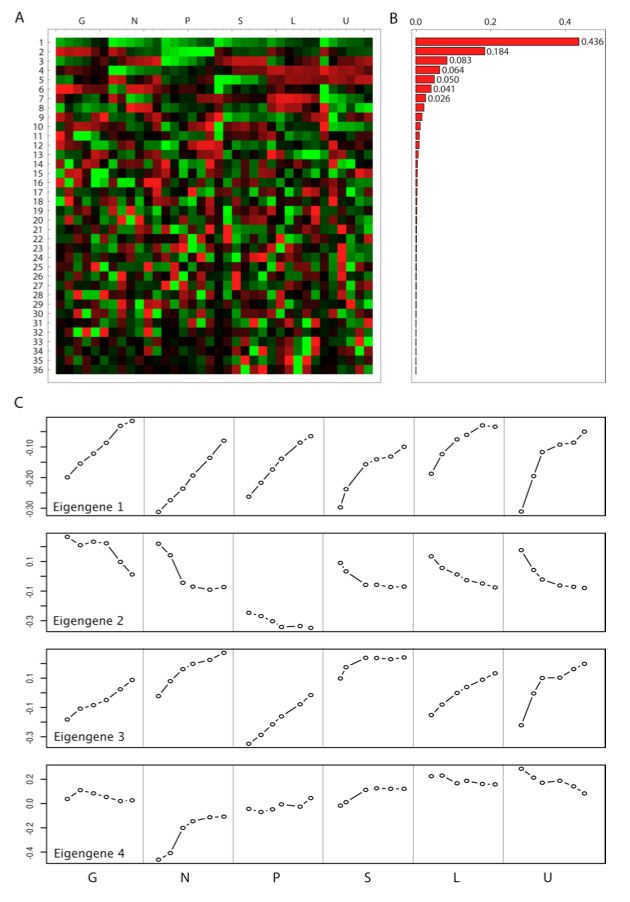
SVD decomposition of expression data. Singular value decomposition of the growth rate/nutrient limitation microarray data shows that a large portion of the variation in gene expression (>70%) is related to changes in growth rate. Secondary eigengenes also capture nutrient-specific responses (e.g. phosphate and sulfate). (A) 36 eigengenes. (B) Eigengene weights (eigenvalues). (C) Expression levels of the four most significant eigengenes.
Figure as PDF