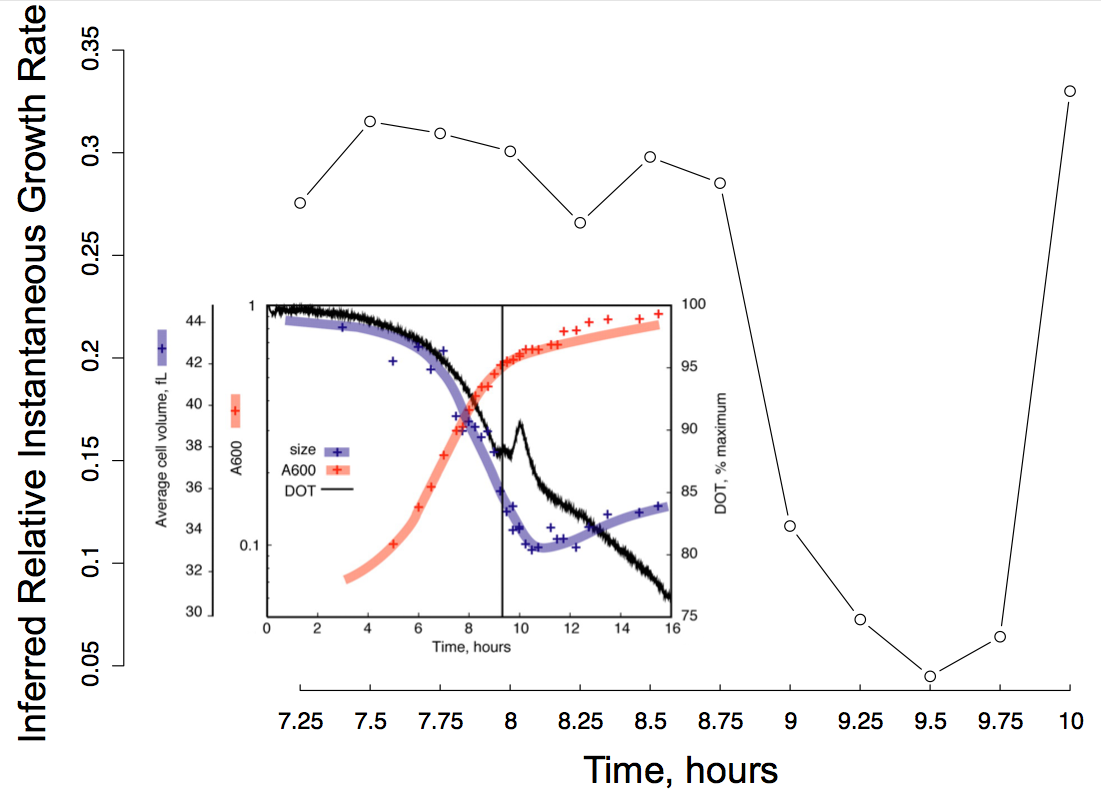
Inferred instantaneous growth rates in batch culture undergoing the diauxic shift. The main figure shows the relative growth rates inferred by our linear model from microarray data in Brauer et al. 2005. The inset, from Brauer et al., demonstrates that their observed variations in cell volume and dissolved oxygen exactly match our predicted cessation of growth as the diauxic shift occurs (ca. 9.25-9.75hr).
Figure as PDF