Complete results indicating the growth rate slope, goodness of fit, and other parameters based on our expression data and linear model. The linear model assigns each gene a growth rate slope (i.e. response to increased growth rate), baseline response, and goodness of fit (i.e. linearity of response) based on our 36 microarrays. The statistical significance of these parameters was tested against a null distribution based on 100,000 bootstrap samples. We have also indicated whether each gene is in our positively or negatively growth correlated gene sets, whether it is up- or down-regulated in the Environmental Stress Response of Gasch et al. 2000, whether it was used as a calibration gene for inferring instantaneous growth rates, and whether it was reliably unresponsive to changes in growth rate.
Genes significantly upregulated with increased growth rate (slope >1.5, >2, or >3 standard deviations) are enriched for ribosomal, translational, and mitochondrial function and structure; the enrichment for cytosolic ribosomes and translation persists into gene sets extremely well-correlated with growth rate. Genes negatively correlated with growth rate (slope <1.5, <2, or <3 standard deviations) are enriched for various metabolic processes, particularly oxidative metabolism and the peroxisome, the latter of which also persists into strongly anticorrelated gene sets. We also find a wide variety of cellular processes and components uncorrelated with growth rate, and enrichment for various metabolic, translational, and other processes in genes overlapping with the Environmental Stress Response of Gasch et al. 2000.
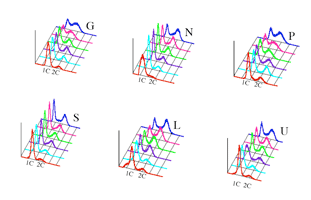
Flow cytometry of the DNA content in chemostat cultures. The cultures limited on G (glucose), N (nitrogen), S (sulfur), L (leucine) and U (uracil) were the same ones used in the remainder of the paper. For technical reasons, the P (phosphate) data are from a duplicate experiment of essentially identical design. Staining was with Sytox green. 1C and 2C indicate the position of haploid and diploid DNA contents, respectively. The data are plotted by increasing dilution rate from front to back: in vol/hr the are 0.05 (red), 0.1 (teal) 0.15 (purple), 0.22 (green), 0.28 (magenta) and 0.34 (blue).
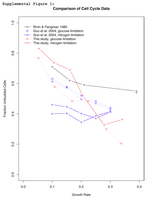
Unbudded cell fraction with varying growth rate as measured by multiple publications. As predicted by Unger and Hartwell, we observe that slower growing cells spend a greater proportion of the time in an unbudded state (G0/G1). This occurs in both glucose and nitrogen limited cultures, in contrast to the findings of Guo et al. 2004.

Culture density is a linear function of total cell volume for all growth conditions. Total cell volume was calculated as the product of the number of cells in a sample (estimated by Coulter Counter) and the average cell volume (also by Coulter Counter).

Growth curves for "unnatural" limitations.
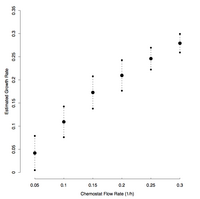
Cross-validation of estimated instantaneous growth rates. Averages plus or minus one standard deviation from 100 cross-validation experiments, where 2/3 of the microarrays were used to fit the linear growth rate model and to identify a corresponding set of calibration genes, and the remaining 1/3 of the microarrays were used as a test set.