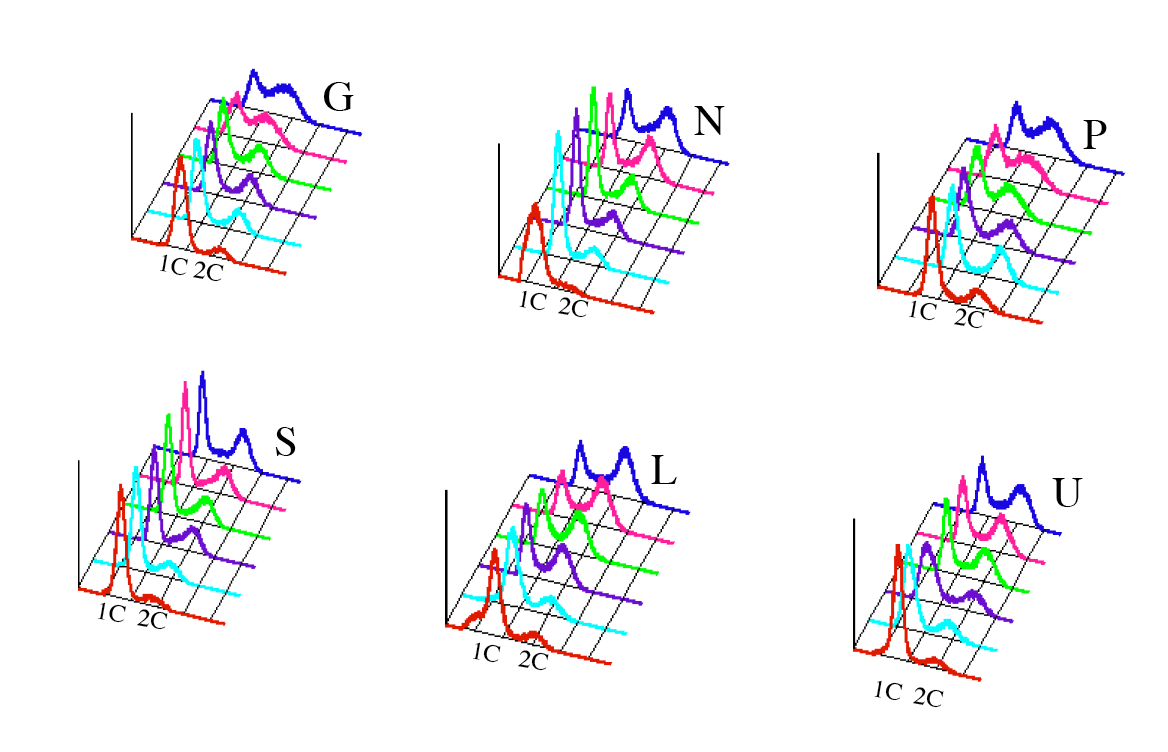
Flow cytometry of the DNA content in chemostat cultures. The cultures limited on G (glucose), N (nitrogen), S (sulfur), L (leucine) and U (uracil) were the same ones used in the remainder of the paper. For technical reasons, the P (phosphate) data are from a duplicate experiment of essentially identical design. Staining was with Sytox green. 1C and 2C indicate the position of haploid and diploid DNA contents, respectively. The data are plotted by increasing dilution rate from front to back: in vol/hr the are 0.05 (red), 0.1 (teal) 0.15 (purple), 0.22 (green), 0.28 (magenta) and 0.34 (blue).
PDF for this figure