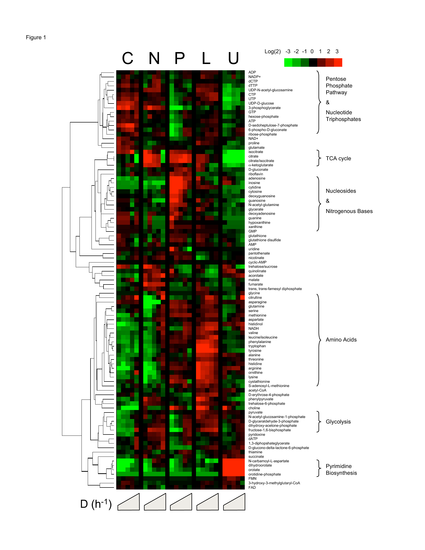
Figure 1. Clustered
heat map of yeast metabolome variation as a function
of growth rate and identity of the limiting nutrient.† Rows represent specific intracellular
metabolites.† Columns represent different
chemostat dilution rates (equivalent to steady-state
cellular growth rates) for different limiting nutrients
(C = limitation for the carbon source, glucose;
N = limitation for the nitrogen source, ammonium;
P = limitation for the phosphorus source, phosphate;
L = limitation for leucine in a leucine auxotroph; U = limitation for uracil in a uracil
auxotroph).† Plotted metabolite levels
are log2-transformed ratios of the measured sample concentration to
the geometric mean concentration of the metabolite across all conditions.† Data for each metabolite is mean-centered,
such that the average log2(fold-change)
across all samples is zero.† Dilution
rates increase within each condition from left to right from 0.05 to 0.3 h-1.
Plotted values are the median of N = 4 independent samples from each chemostat.
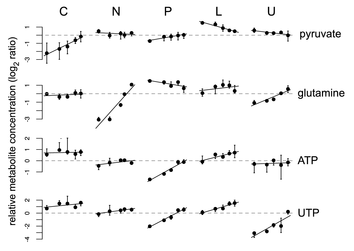
Figure 2. Examples
of metabolites that are potentially limiting growth under glucose limitation,
ammonium limitation, phosphate limitation and uracil
limitation (from top to bottom). Metabolite concentrations are plotted
on a log2 scale and mean-centered as per Figure 1.† Values represent the median (black circles)
and inter-quartile range (bars) of N = 4 independent samples from each chemostat.† For a
given limiting nutrient, steady-state growth rate increases from left to right
from 0.05 to 0.3 h-1.†
Limiting nutrients are as per Figure 1: C = limitation for the
carbon source, glucose; N = limitation for the nitrogen source,
ammonium; P = limitation for the phosphorus source, phosphate;
L = limitation for leucine in a leucine auxotroph; U = limitation for uracil in a uracil auxotroph.† Trend lines are a fit to the linear model
described in Figure 3.
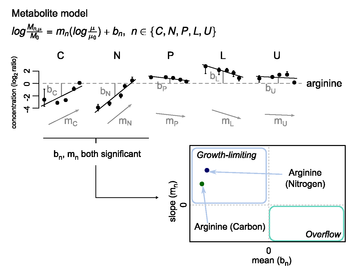
Figure 3. Model-based
determination of the nutrient mean effect and growth rate slope, using arginine as an example metabolite.† Arginine
concentration data (plotted using the same conventions as in Figure 2) were fit
to Eqn 2; bn is
the nutrient mean effect and mn is
the growth rate slope. Units of the nutrient mean effect are log2(fold-change)
and of the growth rate slope are log2(fold-change)/(growth
rate).† For example, a nutrient mean
effect of -2 (as found for arginine in glucose
limitation) implies that the average arginine
concentration in glucose limitation is one-quarter (i.e., 2-2) the
overall average.† Once growth rate slope
and nutrient mean effects are calculated, they can be plotted against each
other (lower right panel).†
Candidate-growth limiting metabolites have a negative nutrient mean
effect and a positive growth rate slope, and accordingly fall in the upper left
quadrant.† Overflow metabolites have a
positive nutrient mean effect and negative growth rate slope, and accordingly
fall in the lower right quadrant.†
Compound-nutrient pairs are plotted when the nutrient mean effect and
growth rate slope are both significant at FDR < 0.1.† For arginine, this
occurred in nitrogen limitation and in carbon limitation, but not in the other
nutrient conditions.† In both nitrogen limitation
and carbon limitation, arginine showed a growth
limiting pattern.
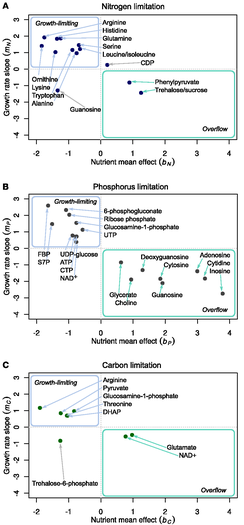
Figure 4.† Growth-limiting and overflow metabolites.† Data for all metabolites were fit to the
model exemplified in Figure 3.† Resulting
plots of growth rate slope versus nutrient mean effect are shown here.† (A) Nitrogen (ammonium) limitation. (B)
Phosphorus (phosphate) limitation. (C) Carbon (glucose) limitation.† For all plotted metabolites, both the growth
rate slope and nutrient mean effect were significant (FDR < 0.1).† In each plot, candidate growth-limiting
metabolites are found in the upper left quadrant, and overflow metabolites in
the lower right quadrant.
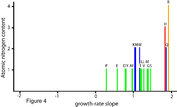
Figure 5. Growth-rate slope for
amino acids under nitrogen limitation. The positive growth rate slope found for
every amino acid implies that, under nitrogen limitation, each amino acidís
intracellular concentration increases with faster cellular growth rate (i.e.,
with partial relief of the nitrogen limitation). Amino acids are abbreviated by
standard single-letter code.†

Figure 6. Adenylate energy charge across
conditions and growth rates. Conventions are as per Figure 2:† limiting nutrients are
C = limitation for the carbon source, glucose;
N = limitation for the nitrogen source, ammonium;
P = limitation for the phosphorus source, phosphate; L = limitation
for leucine in a leucine
auxotroph; U = limitation for uracil in a uracil auxotroph.†
Within each condition, steady-state growth rate increases from left to
right from 0.05 to 0.3 h-1.†
Black circles represent the median of N = 4 independent samples from
each chemostat. †Absolute intracellular concentrations of ATP,
ADP, AMP, and adenosine were ~ 2.7 mM, 0.6 mM, 1.0 mM, and 0.2 mM in the slowest-growing phosphorous-limited chemostats, and 13 mM, 0.8 mM, 1.4 mM, and 0.002 mM in the slowest-growing carbon-limited chemostats.† Absolute
concentrations in other conditions can be calculated from these values and the
relative concentration data provided in Dataset 1.
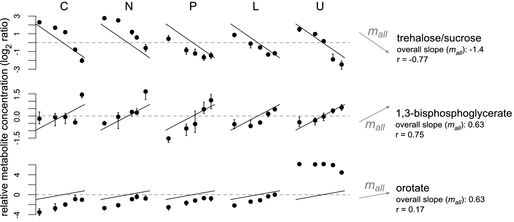
Figure 7. Metabolites with
consistent growth rate responses across conditions. Conventions are as per
Figure 2:† limiting nutrients are C =
limitation for the carbon source, glucose; N = limitation
for the nitrogen source, ammonium; P = limitation for the
phosphorus source, phosphate; L = limitation for leucine in a leucine auxotroph; U
= limitation for uracil in a uracil auxotroph.†
Within each condition, steady-state growth rate increases from left to
right from 0.05 to 0.3 h-1.†
Metabolites were fit to the single-parameter model in Equation 6, with mall
representing the overall growth-rate slope.†
The r values indicate goodness
of fit.† Note that orotate
concentrations consistently increase with faster growth except under uracil limitation, where the knockout of URA3 causes
the build-up of orotate.
Figure 8. Dynamic
range of extracellular and intracellular small molecules, transcripts, and
cellular growth rate.† Dynamic
range refers to the maximum fold-change across all experiments. Reported values
for nutrients, metabolites, and transcripts are the median across all measured
species.† For nutrients, the measured
species are glucose (across all conditions), leucine
(in leucine limitation), and uracil
(in uracil limitation). Note that transcripts were
measured by microarray; measurement by sequencing might yield a larger dynamic
range.